Study AWS Aurora Serverless v2
Amazon launched Aurora Serverless v2 on Apr 21, 2022. Aurora Serverless v2 is designed for applications that have variable workloads. The DB capacity dynamically changes as the workload changes, so we don’t need to provision the capacity to meet the demand of peak load. I evaluated Aurora Serverless v2 to check actual behaviors and fitness for production applications.
On this post, Aurora Serverless v2 PostgreSQL was used for evaluation. Note that MySQL compatible edition is out of scope.
Pricing
Pricing page of Aurora 1 Aurora capacity unit (ACU) = approximately 2 gibibytes (GiB) of memory, corresponding CPU, and networking. Note that I use the terms “ACU” and “DB capacity” interchangeably on this document.
In US East region as of Mar. 1, 2024, $0.12 per ACU hour for Aurora Standard.
- $0.12 per vCPU hour
- $0.06 per GiB memory hour
Reference: provisioned on-demand instance
For db.r7g.large (2 vCPU, 16 GiB Memory, up to 12.5 Gbps Network bandwidth), $0.276 per hour
- $0.138 per vCPU hour (115% of serverless)
- $0.017 per GiB memory hour (29% of serverless)
Per vCPU hour cost of Aurora Serverless v2 seems good. On the other hand, per memory hour cost is much poorer than provisioned instance. It means applications that have following performance characteristic are likely to be suitable for Aurora Serverless v2 than provisioned instance:
- Handles many concurrent queries at peak times. (high CPU demand)
- The size of data set that the application mainly works on is relatively small. (low memory space demand)
Aurora Serverless v2 has only pricing for on-demand use.
Provisioned instance is more cost efficient if you used reserved instance.
e.g. if you paid all upfront for 3 years reserved instance of db.r6.large, you can save 65% compared to on demand price.
If your purpose to use Aurora Serverless v2 is to save cost, you should carefully compare the cost of serverless and provisioned instance.
Considerations for DB instance configurations
Capacity configuration
Although Aurora Serverless v2 adaptively scale, there are some considerations to avoid a performance cliff in case of a sudden surge of requests. Particularly, too small minimum capacity is problematic for the following issues.
We recommend setting the minimum to a value that allows each DB writer or reader to hold the working set of the application in the buffer pool. That way, the contents of the buffer pool aren’t discarded during idle periods.
(From How Aurora Serverless v2 works)
Note that “buffer pool” is “shared buffers” in postgres terminology.
The scaling rate for an Aurora Serverless v2 DB instance depends on its current capacity. The higher the current capacity, the faster it can scale up. If you need the DB instance to quickly scale up to a very high capacity, consider setting the minimum capacity to a value where the scaling rate meets your requirement.
(From Considerations for the minimum capacity value)
DB parameters
There are certain differences of DB parameters related to DB capacity between provisioned instance and Aurora Serverless v2. I explain only overview here. For further information, please read AWS documentation working with parameter groups.
shared_buffersparameter is dynamically updated during scaling. Also, custom parameter values that you specify by DB parameter group is never used.- For some parameters, e.g.
max_connections, when Aurora Serverless v2 evaluates the formula, it uses the memory size based on the maximum Aurora capacity units (ACUs) for the DB instance, not the current ACU value.
Expected scaling behaviors
You can find descriptions about how and when scaling events are triggered by Aurora Serverless v2 on the documents.
I quoted some important points as follows.
Scaling is fast because most scaling events operations keep the writer or reader on the same host. In the rare cases that an Aurora Serverless v2 writer or reader is moved from one host to another, Aurora Serverless v2 manages the connections automatically.
Aurora Serverless v2 scaling can happen while database connections are open, while SQL transactions are in process, while tables are locked, and while temporary tables are in use. Aurora Serverless v2 doesn’t wait for a quiet point to begin scaling. Scaling doesn’t disrupt any database operations that are underway.
Scaling of reader instances
Readers in promotion tiers 0 and 1 scale at the same time as the writer. That scaling behavior makes readers in priority tiers 0 and 1 ideal for availability. That’s because they are always sized to the right capacity to take over the workload from the writer in case of failover.
Evaluation
I demonstrated simple benchmarking to evaluate scaling behavior of Aurora Serverless v2. Especially, the following points were evaluated:
- Timing of scale up / down
- How fast does scale up happen in case of sudden increase of load?
- After a surge of load, when does it decide to scale in?
- Is scaling event really seamless?
- How min/max ACU configurations impact scale up/down behavior
Note that there are a lot of details about experiments on the next sections. If you are not interested, please skip to “Overall observations from experiments” section.
Evaluation method
Evaluation environment
I used an Aurora Cluster of PostgreSQL 15.5 that has 1 writer instance of db.serverless class, i.e. Serverless v2, in us-east-1 region.
DB parameters were the default values except some logging related ones, e.g. pg_stat_statement was enabled.
I tried some min/max DB capacity settings as the document told that the scaling rate depends on the current DB capacity.
Benchmark workload
Since our application tends to have a bottleneck on write workload, I used write only workload on the benchmark.
The benchmark application runs multiple threads and each thread repeats a query that upsert (mostly update) 20 tuples. The average tuple size was 57 bytes including tuple header, i.e. 1140 bytes/query were written on average. All working data set basically fits into shared_buffers even on the smallest ACU I used, i.e. ACU = 1, shared_buffers = 384MiB.
The workload was changed by varying number of threads from 1 to 32.
The benchmark was executed long enough so that the throughput became steady. The benchmark client server was large enough so that it wasn’t to be a bottleneck unless explicitly described. I monitored and confirmed that the client wasn’t actually a bottleneck while running the benchmark.
Monitoring method of scaling behavior
- Monitor the following CloudWatch metrics that AWS document suggested on CloudWatch dashboard
ServerlessDatabaseCapacityACUUtilizationCPUUtilization- This metric is calculated as the amount of CPU currently being used divided by the CPU capacity that’s available under the maximum ACU value of the DB cluster (doc). It means that CPU utilization won’t be 100% unless the instance has the max capacity.
- Utilization for the current capacity can be calculated as
CPUUtilization / (current capacity / max capacity).
FreeableMemory- Note that we usually use DataDog for monitoring and these CloudWatch metrics are available too. However, the granularity of metrics is 1 minutes on DataDog even though those metrics are calculated every second. On CloudWatch dashboard, you can see those metrics in 1 second resolution.
- Monitor
shared_bufferschange on PostgreSQL session- We cannot directly check actual vCPUs and available memory size on DB when ACU was updated. I tried to observe change of available resources by
shared_buffersbecause dynamically changes by scale up/down. - It was monitored like as follows
- We cannot directly check actual vCPUs and available memory size on DB when ACU was updated. I tried to observe change of available resources by
postgres=# \x
Expanded display is on.
postgres=# select pg_size_pretty(setting::bigint * 8192) shared_buffers from pg_settings where name = 'shared_buffers';
-[ RECORD 1 ]--+-------
shared_buffers | 128 MB

postgres=# \watch 1
Mon Mar  4 17:01:47 2024 (every 1s)

-[ RECORD 1 ]--+-------
shared_buffers | 128 MB

Mon Mar  4 17:01:48 2024 (every 1s)

-[ RECORD 1 ]--+-------
shared_buffers | 128 MB
...
Experiments and results
Basic scaling behavior (experiment with DB min/max = 1.0/4.0, Bench threads = 1)
As the first experiment, I used relatively small DB capacity configuration (min = 1.0, max = 4.0) and ran the benchmark with single thread. I observed how Aurora Serverless v2 scaled while running the benchmark.
-
CrowdWatch metrics related to scaling
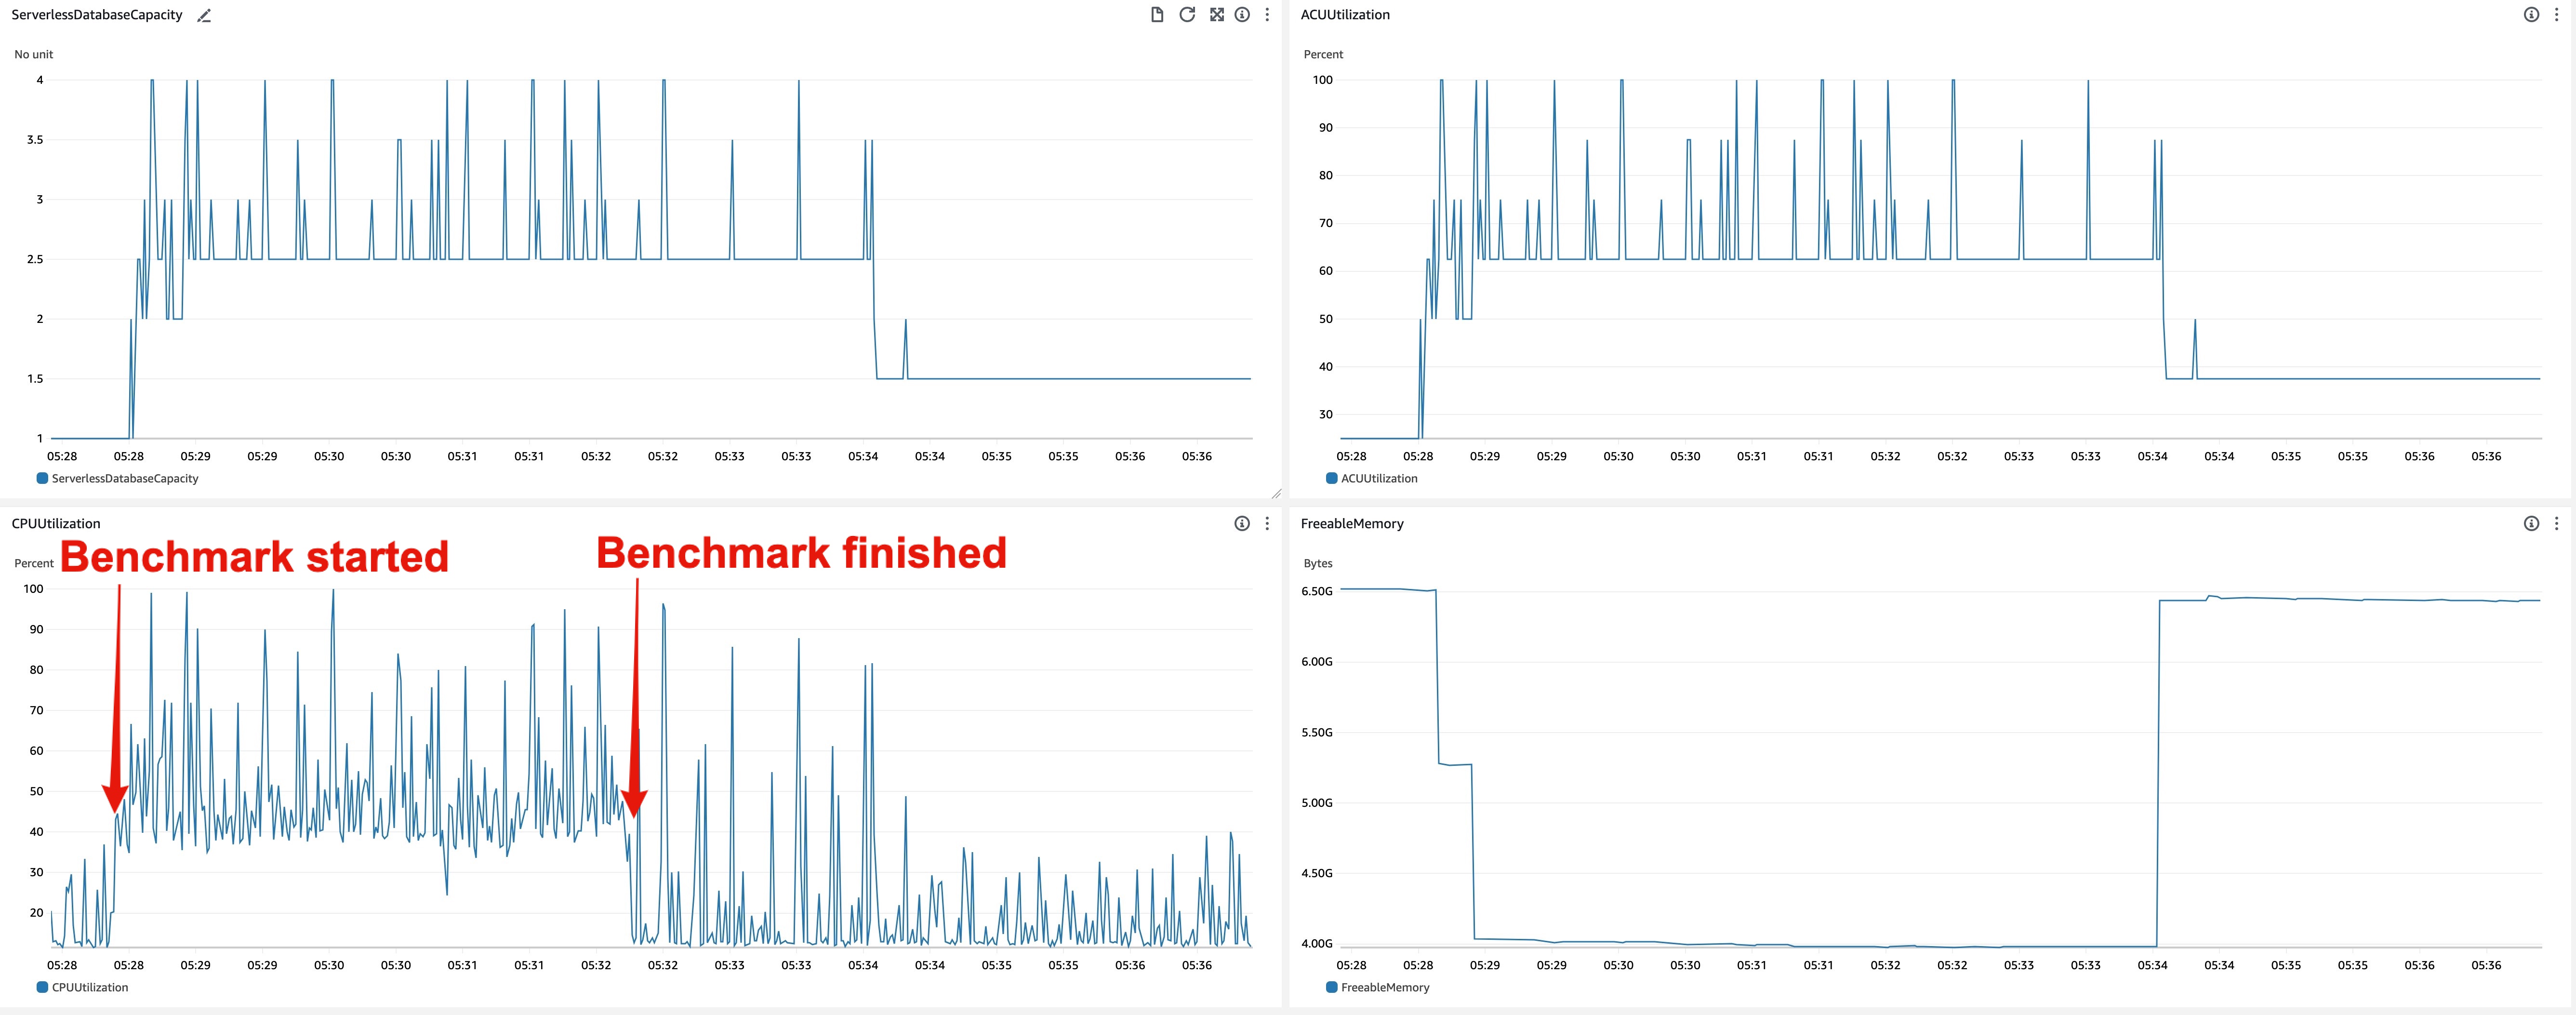
- Scale up behavior
- 05:28:22 - Benchmark started
- 05:28:34 - ACU increased (1.0 -> 2.5)
- 05:28:41 -
shared_buffersincreased (384MiB -> 2688MiB)
- Scale down behavior
- 05:32:14 - Benchmark finished
- 05:33:59 -
shared_buffersdecreased (2688MiB -> 384MiB) - 05:34:07 - ACU decreased (2.5 -> 1.5)
Observations
- Aurora Serverless v2 started scaling up in a few seconds after it detected CPU utilization increase.
- ACU changed so frequently. ACU fluctuated every second while DB received the load.
- On the other hand,
shared_buffersdidn’t change so frequently compared to ACU. It increased only once while running the benchmark.- It seems CPU and memory available for OS immediately when ACU was updated, but
shared_buffersisn’t updated so frequently. - Presumably,
shared_bufferscannot resize so quickly. The overview of shared buffer scale down procedure was explained on p.12 of this slide.
- It seems CPU and memory available for OS immediately when ACU was updated, but
- Unlike scale up, scale down doesn’t happen immediately after DB load dropped. On this experiment, scale down happened in 90 - 120 seconds after DB load decreased.
- CPU utilization and ACU fluctuated while benchmark was running.
- ACU sometimes hit the max capacity (4.0) even though the benchmark had only 1 thread. This is because background processes of PostgreSQL, e.g. auto vacuum worker, checkpointer, background writer, etc, and RDS internal, e.g. agent for cloudwatch metrics, performance insight, use some resources.
- I’m not sure the CPU utilization threshold that scaling if triggered. I haven’t seen any documents that explains actual scale up logic.
- On scale up, ACU increases first and
shared_buffersnext. It is opposite on scale down, i.e.shared_buffersdecreases first and ACU next. - I’ve seen no noticeable outage or delay on ACU and
shared_bufferschanges. Scaling was processed seamlessly for DB clients.
Stress DB more
The scaling rate depends on the current DB capacity. I evaluated how scaling behavior varies by workload and DB capacity setting. Through next some experiments, I stressed DB more and observed scaling behaviors under heavier loads.
Experiment setup is described by the combination of DB capacity configuration (referred to as “DB min/max”) and number of threads of benchmark (referred to as “Bench threads”).
DB min/max = 1.0/4.0, Bench threads = 4
Executed the benchmark with 4 threads that is the same as the max DB capacity configuration. It was to check the behavior when CPU utilization of DB is around 100%.
-
CrowdWatch metrics related to scaling
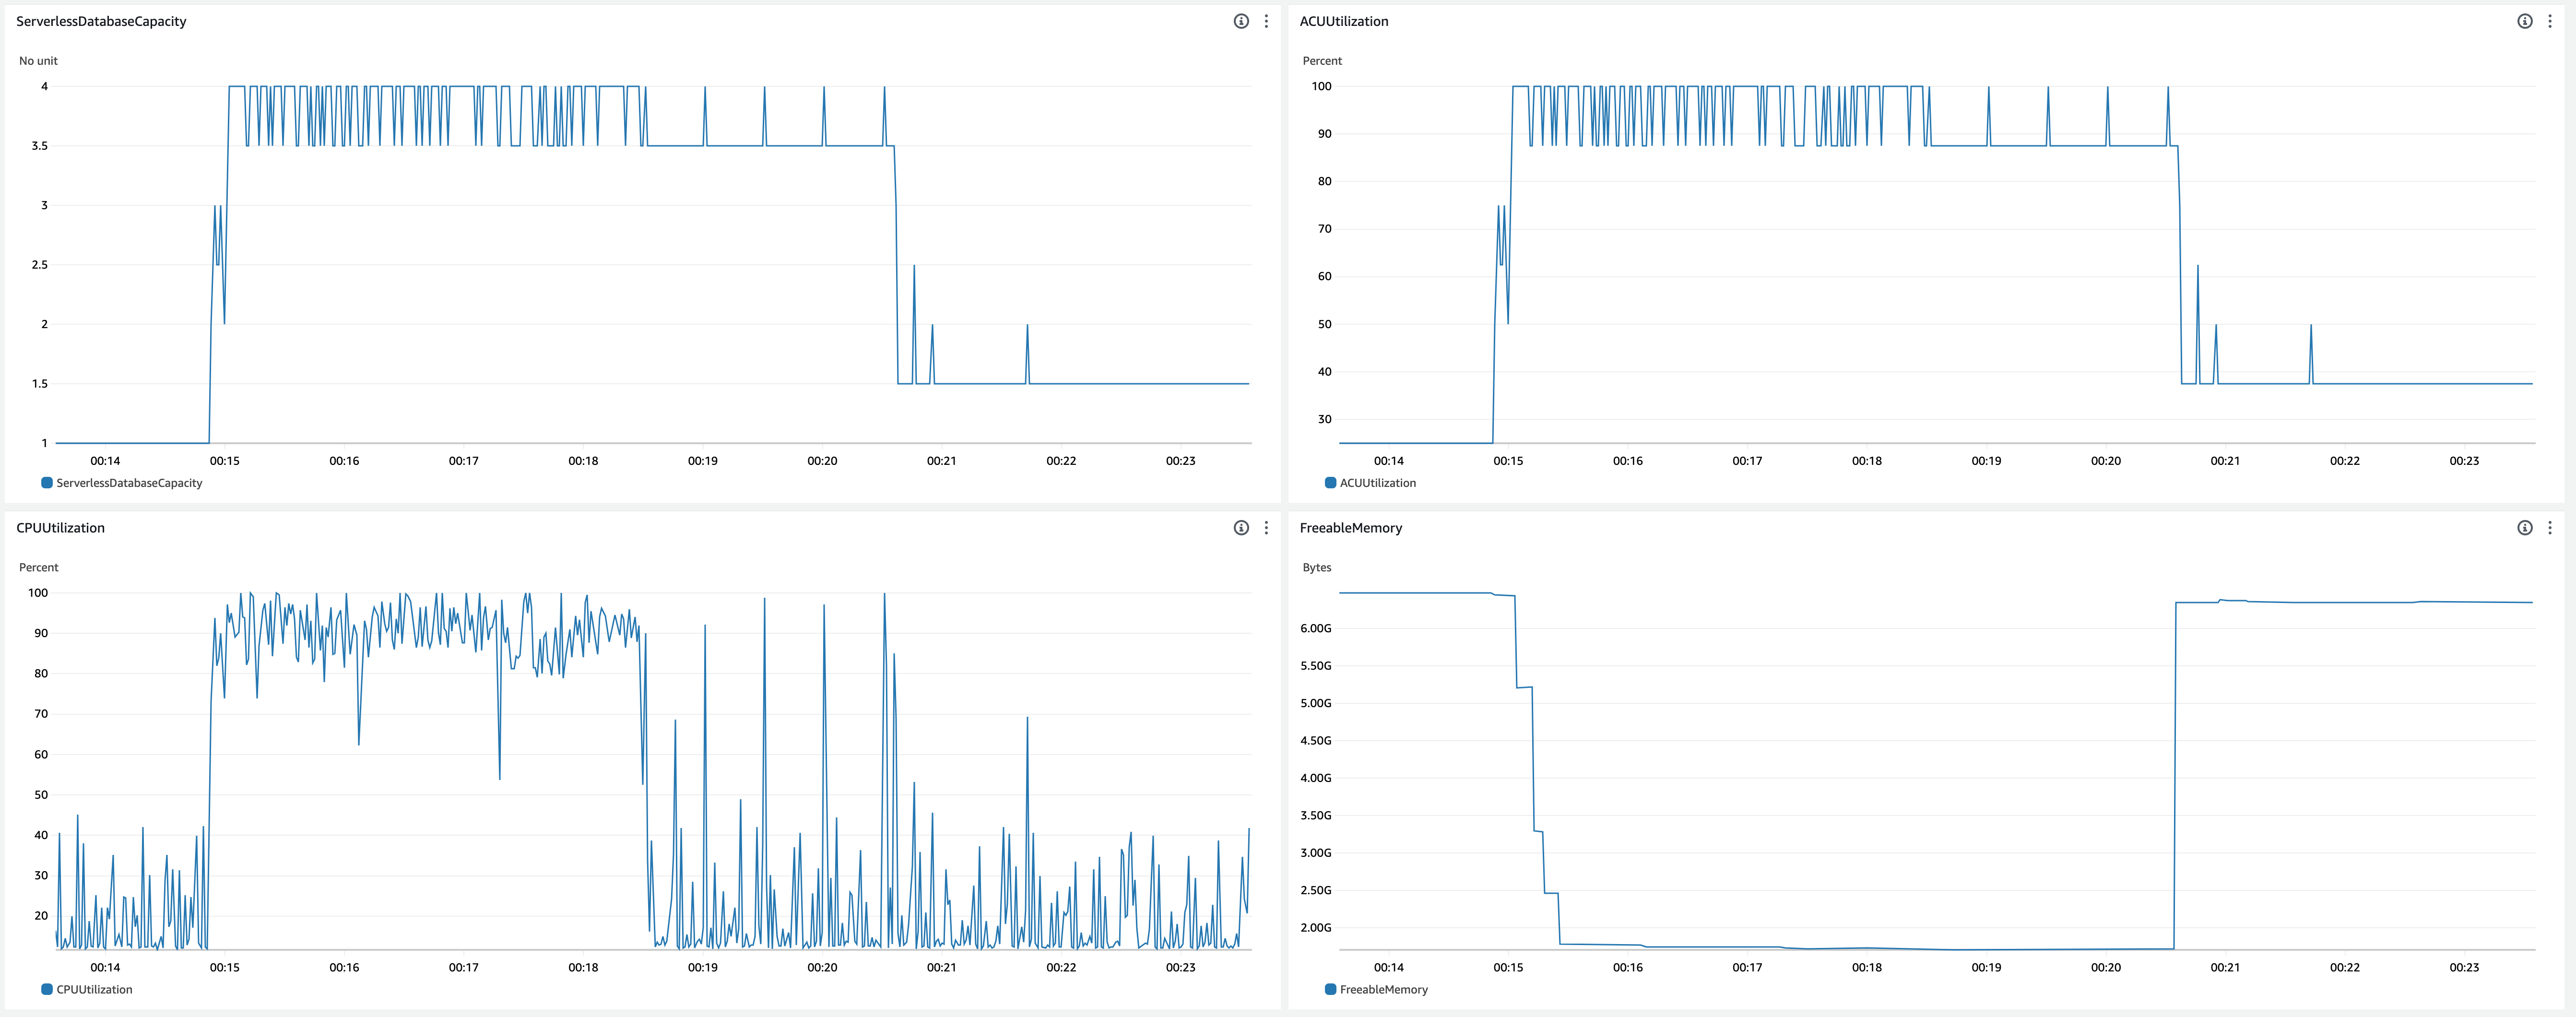
- Scale up behavior
- 00:14:51 - Benchmark started
- 00:14:55 - ACU increased (1.0 -> 3.0)
- 00:15:01 - ACU increased (3.0 -> 4.0)
- 00:15:08 -
shared_buffersincreased (384MiB -> 1536MiB) - 00:15:16 -
shared_buffersincreased (1536MiB -> 3328MiB) - 00:15:21 -
shared_buffersincreased (3328MiB -> 4096MiB) - 00:15:29 -
shared_buffersincreased (4096MiB -> 4736MiB)
- Scale down behavior
- 00:18:30 - Benchmark finished
- 00:20:32 -
shared_buffersdecreased (4736MiB -> 384MiB) - 00:20:38 - ACU decreased (4.0 -> 1.5)
- Observations
- The first scale up happened immediately after CPU utilization increased, but it took 10 seconds to scale up to the max capacity.
- CPU utilization was around 90-100% and ACU fluctuated between 3.5 and 4.0 while benchmark was running.
- CPU utilization was mostly more than 80%, but still scale down happened.
- 4 threads weren’t enough to run out CPU utilization. I tried 6 threads to run out CPU on the next experiment.
DB min/max = 1.0/4.0, Bench threads = 6
Executed the benchmark so as to hit 100% CPU utilization.
-
CrowdWatch metrics related to scaling
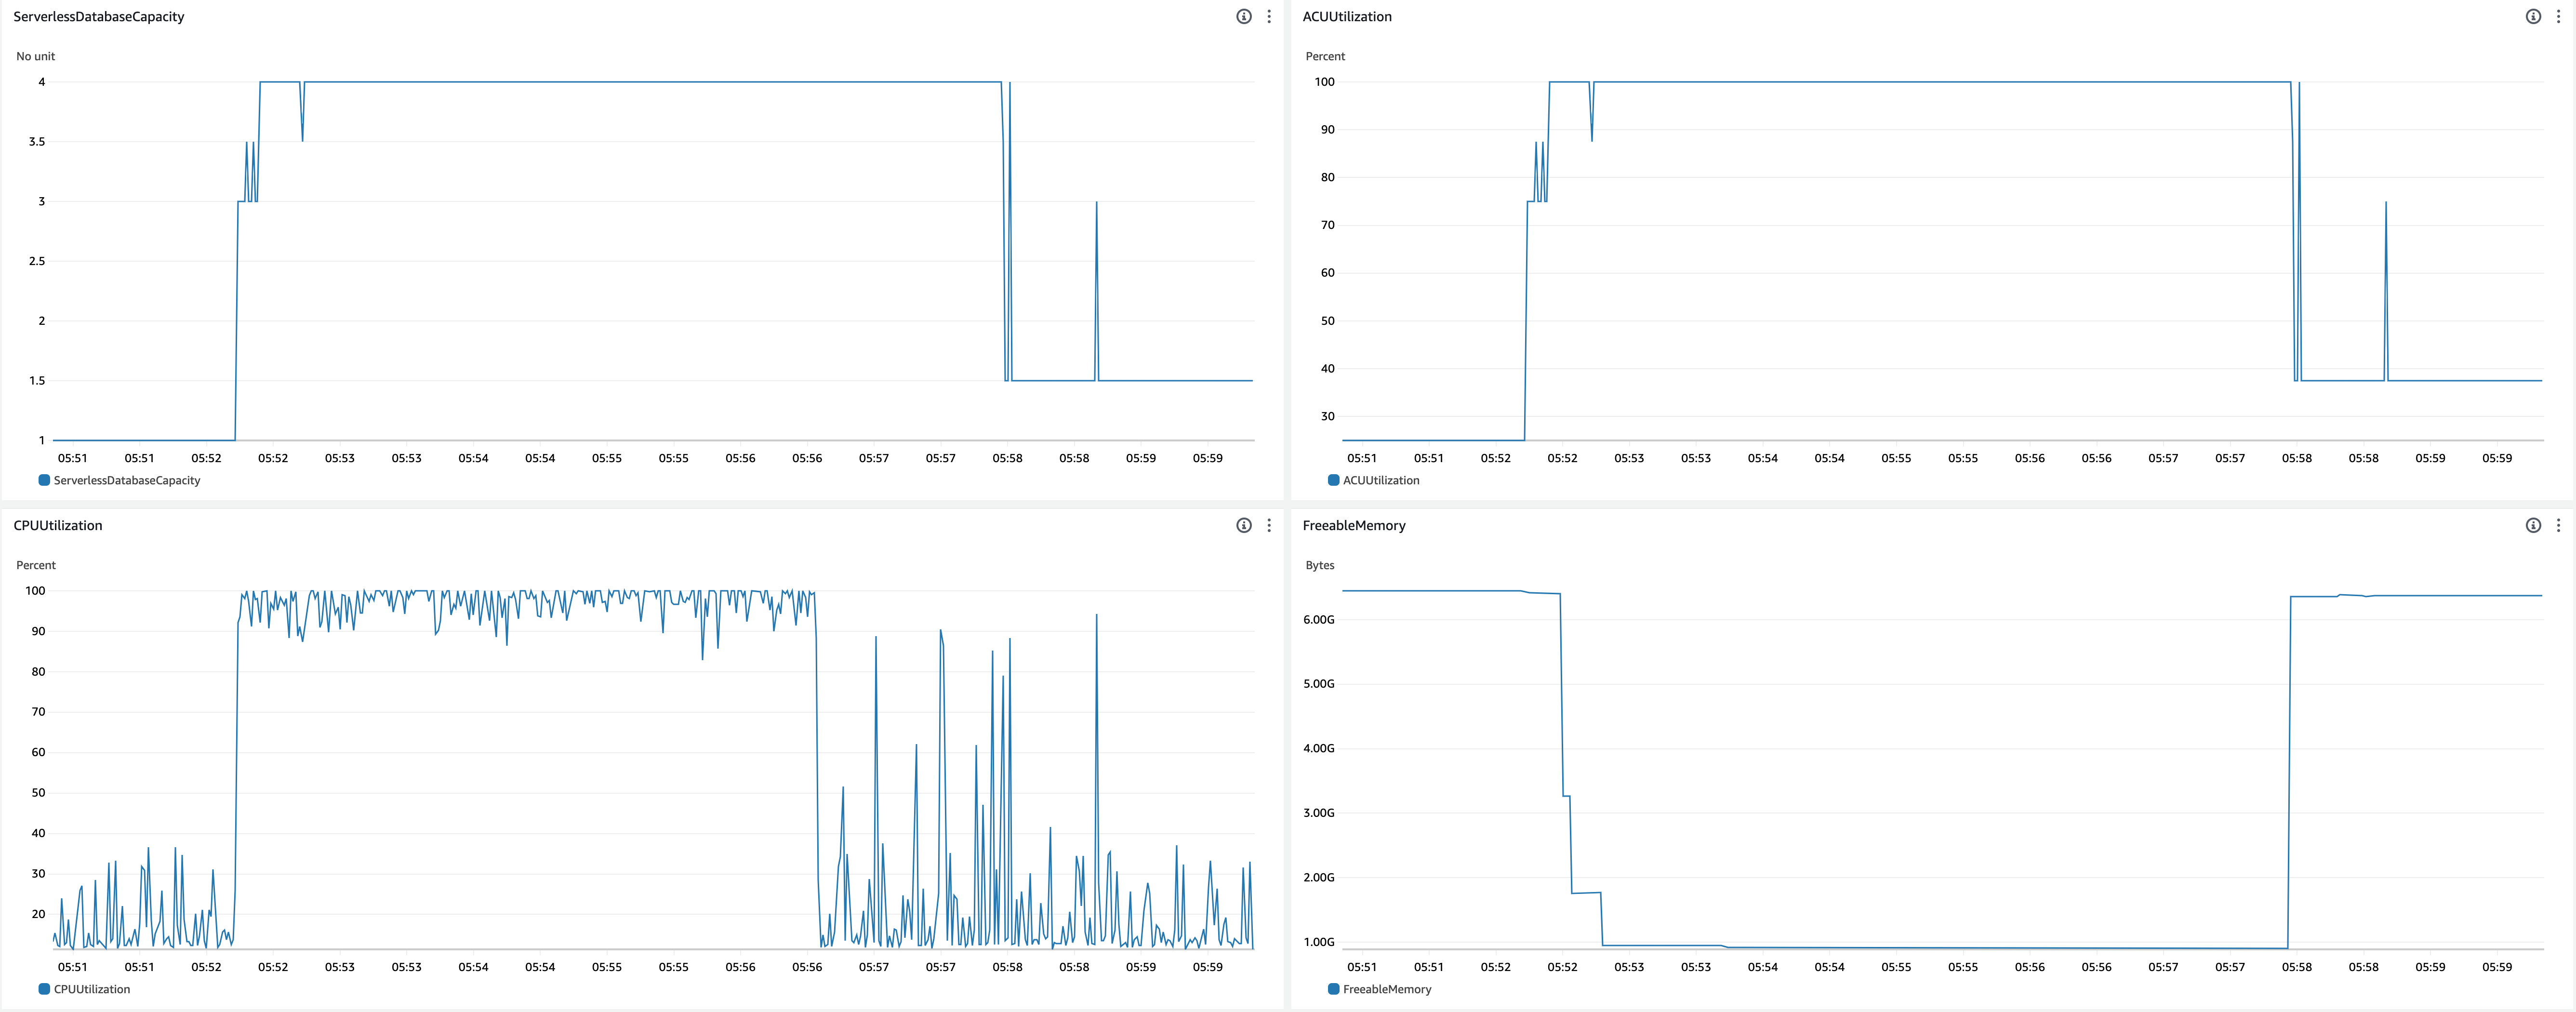
- Scale up behavior
- 05:52:12 - Benchmark started
- 05:52:14 - CPU utilization saturated
- 05:52:14 - ACU increased (1.0 -> 3.0)
- 05:52:24 - ACU increased (3.0 -> 4.0)
- 05:52:34 -
shared_buffersincreased (384MiB -> 3328MiB) - 05:52:38 -
shared_buffersincreased (3328MiB -> 4736MiB) - 05:52:52 -
shared_buffersincreased (4736MiB -> 5504MiB)
- Scale down behavior
- 05:56:35 - Benchmark finished
- 05:57:53 -
shared_buffersdecreased (5504MiB -> 384MiB) - 05:58:02 - ACU decreased (4.0 -> 1.5)
- Observations
- As expected, ACU utilization kept 100% when CPU utilization was mostly 100%.
DB min/max = 1.0/32.0, Bench threads = 16
Checked scaling behavior with larger max DB capacity and larger workload.
-
CrowdWatch metrics related to scaling
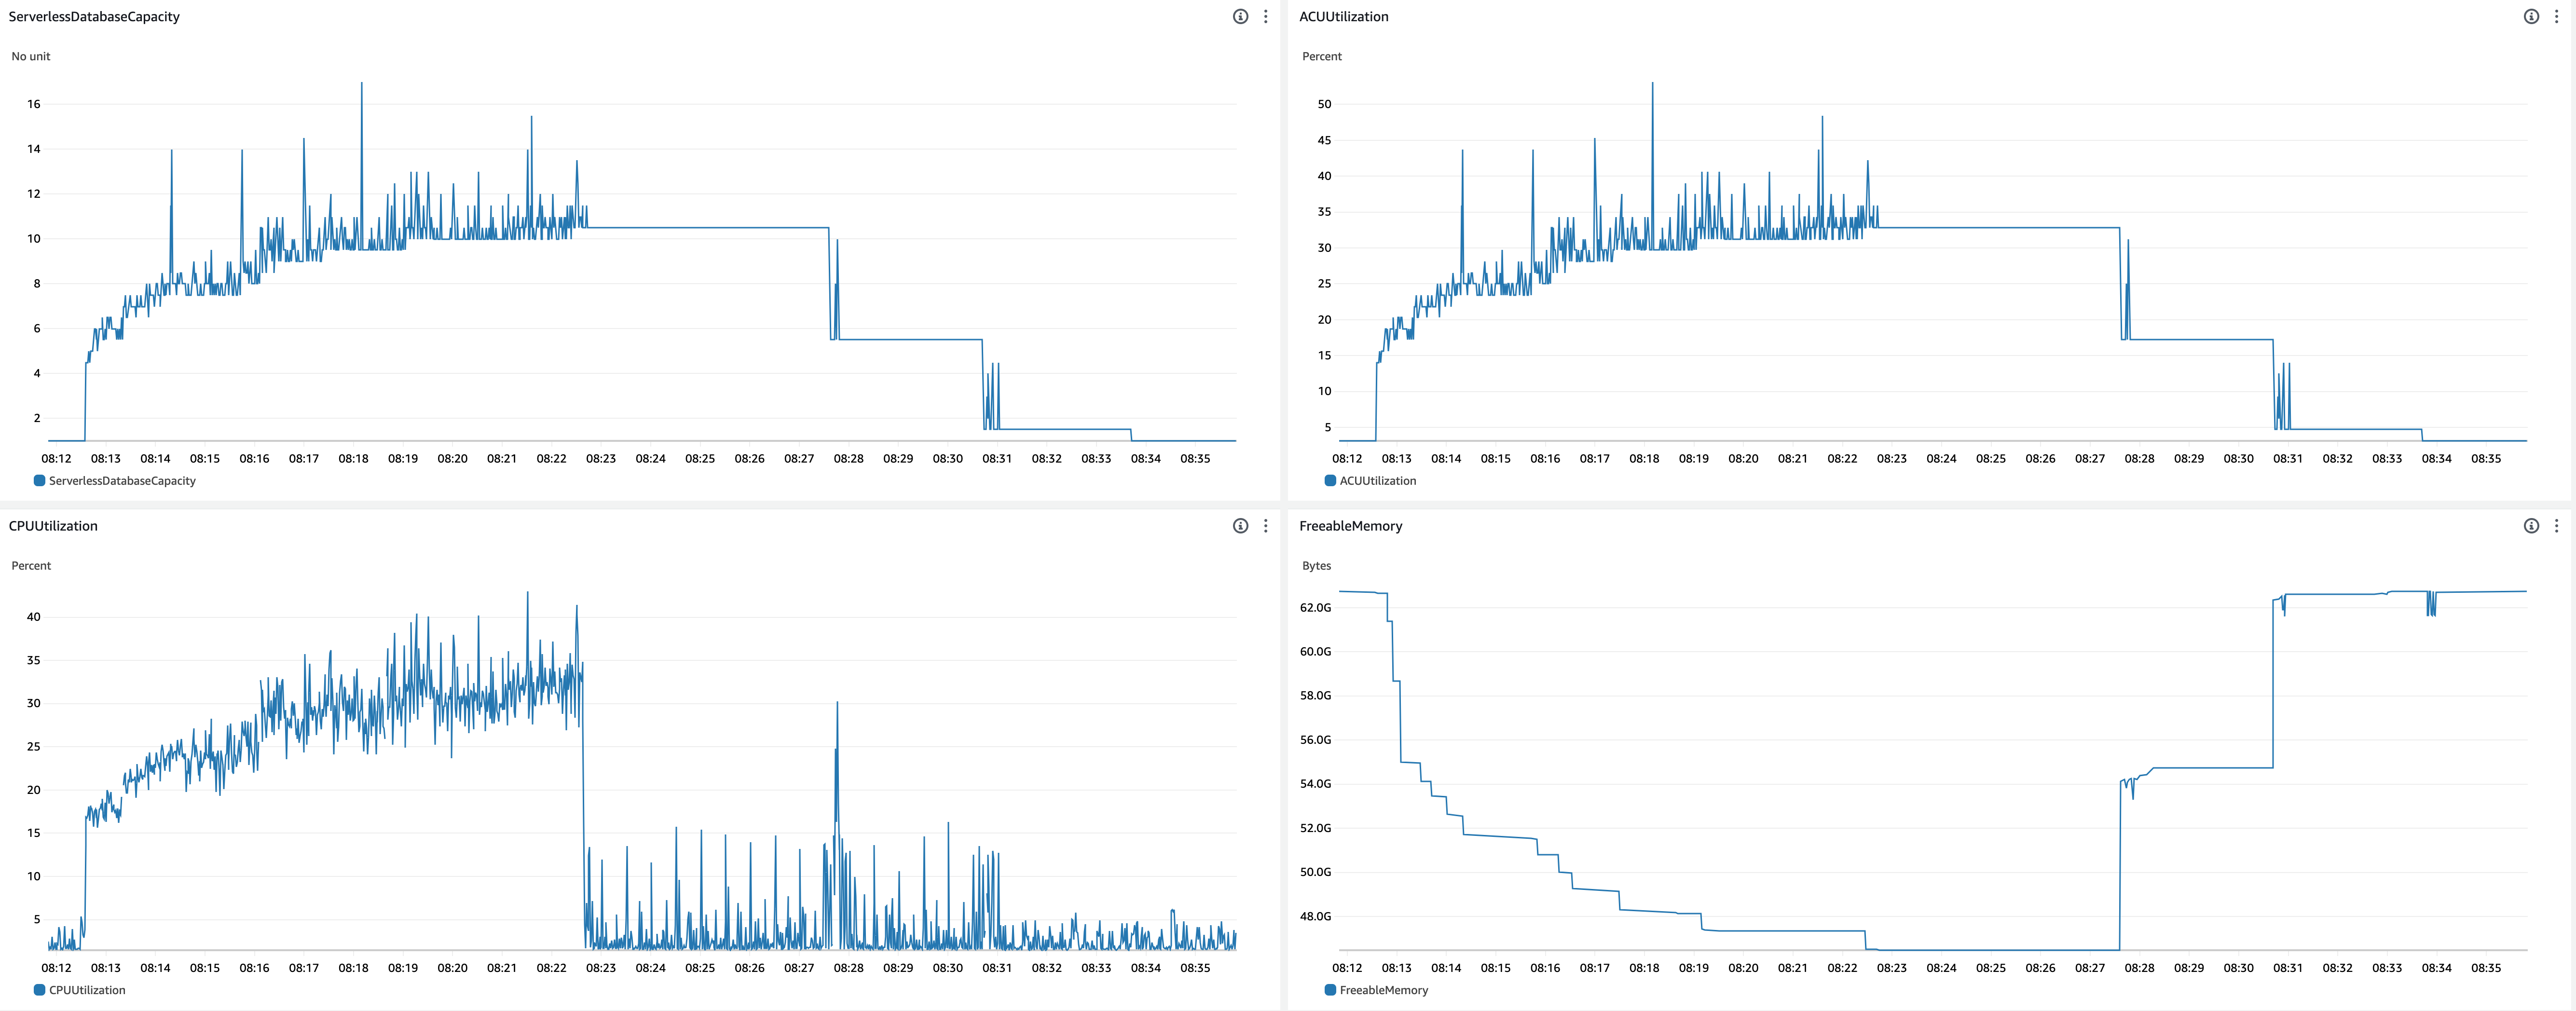
- Scale up behavior
- 08:12:34 - Benchmark started
- 08:12:35 - ACU increased (1.0 -> 3.5)
- After this, ACU gradually increased to 10.5 with some fluctuation
- 08:12:53 -
shared_buffersincreased (384MiB -> 1536MiB) - 08:12:59 -
shared_buffersincreased (1536MiB -> 4096MiB) - 08:13:09 -
shared_buffersincreased (4096MiB -> 7552MiB) - 08:13:32 -
shared_buffersincreased (7552MiB -> 8320MiB) - 08:13:45 -
shared_buffersincreased (8320MiB -> 8960MiB) - 08:14:04 -
shared_buffersincreased (8960MiB -> 9728MiB) - 08:14:24 -
shared_buffersincreased (9728MiB -> 10GiB) - 08:15:54 -
shared_buffersincreased (10GiB -> 11GiB) - 08:16:19 -
shared_buffersincreased (11GiB -> 12GiB) - 08:17:33 -
shared_buffersincreased (12GiB -> 13GiB) - 08:19:13 -
shared_buffersincreased (13GiB -> 14GiB)
- Scale down behavior
- 08:22:40 - Benchmark finished
- 08:27:33 -
shared_buffersdecreased (14GiB -> 7552MiB) - 08:27:38 - ACU decreased (10.5 -> 5.5)
- 08:30:38 -
shared_buffersdecreased (7552MiB -> 384MiB) - 08:30:44 - ACU decreased (5.5 -> 1.5)
- Observations
- The first scale up (ACU 1.0 -> 3.5) happened immediately, but it took time for further scale up.
- Timings of ACU scale up (Note that timings of scale up of ACU and
shared_buffersare different. I focused only ACU scale up here.)- 2 seconds to scale up ACU from 1.0 to 4.0.
- 73 seconds to scale up ACU from 4.0 to 8.0.
- 138 seconds to scale up ACU from 8.0 to 10.5.
- CPU utilization for current capacity was almost 100% during scale up.

- Timings of ACU scale up (Note that timings of scale up of ACU and
- Scale down started about 5 minutes after the benchmark finished.
- The first scale up (ACU 1.0 -> 3.5) happened immediately, but it took time for further scale up.
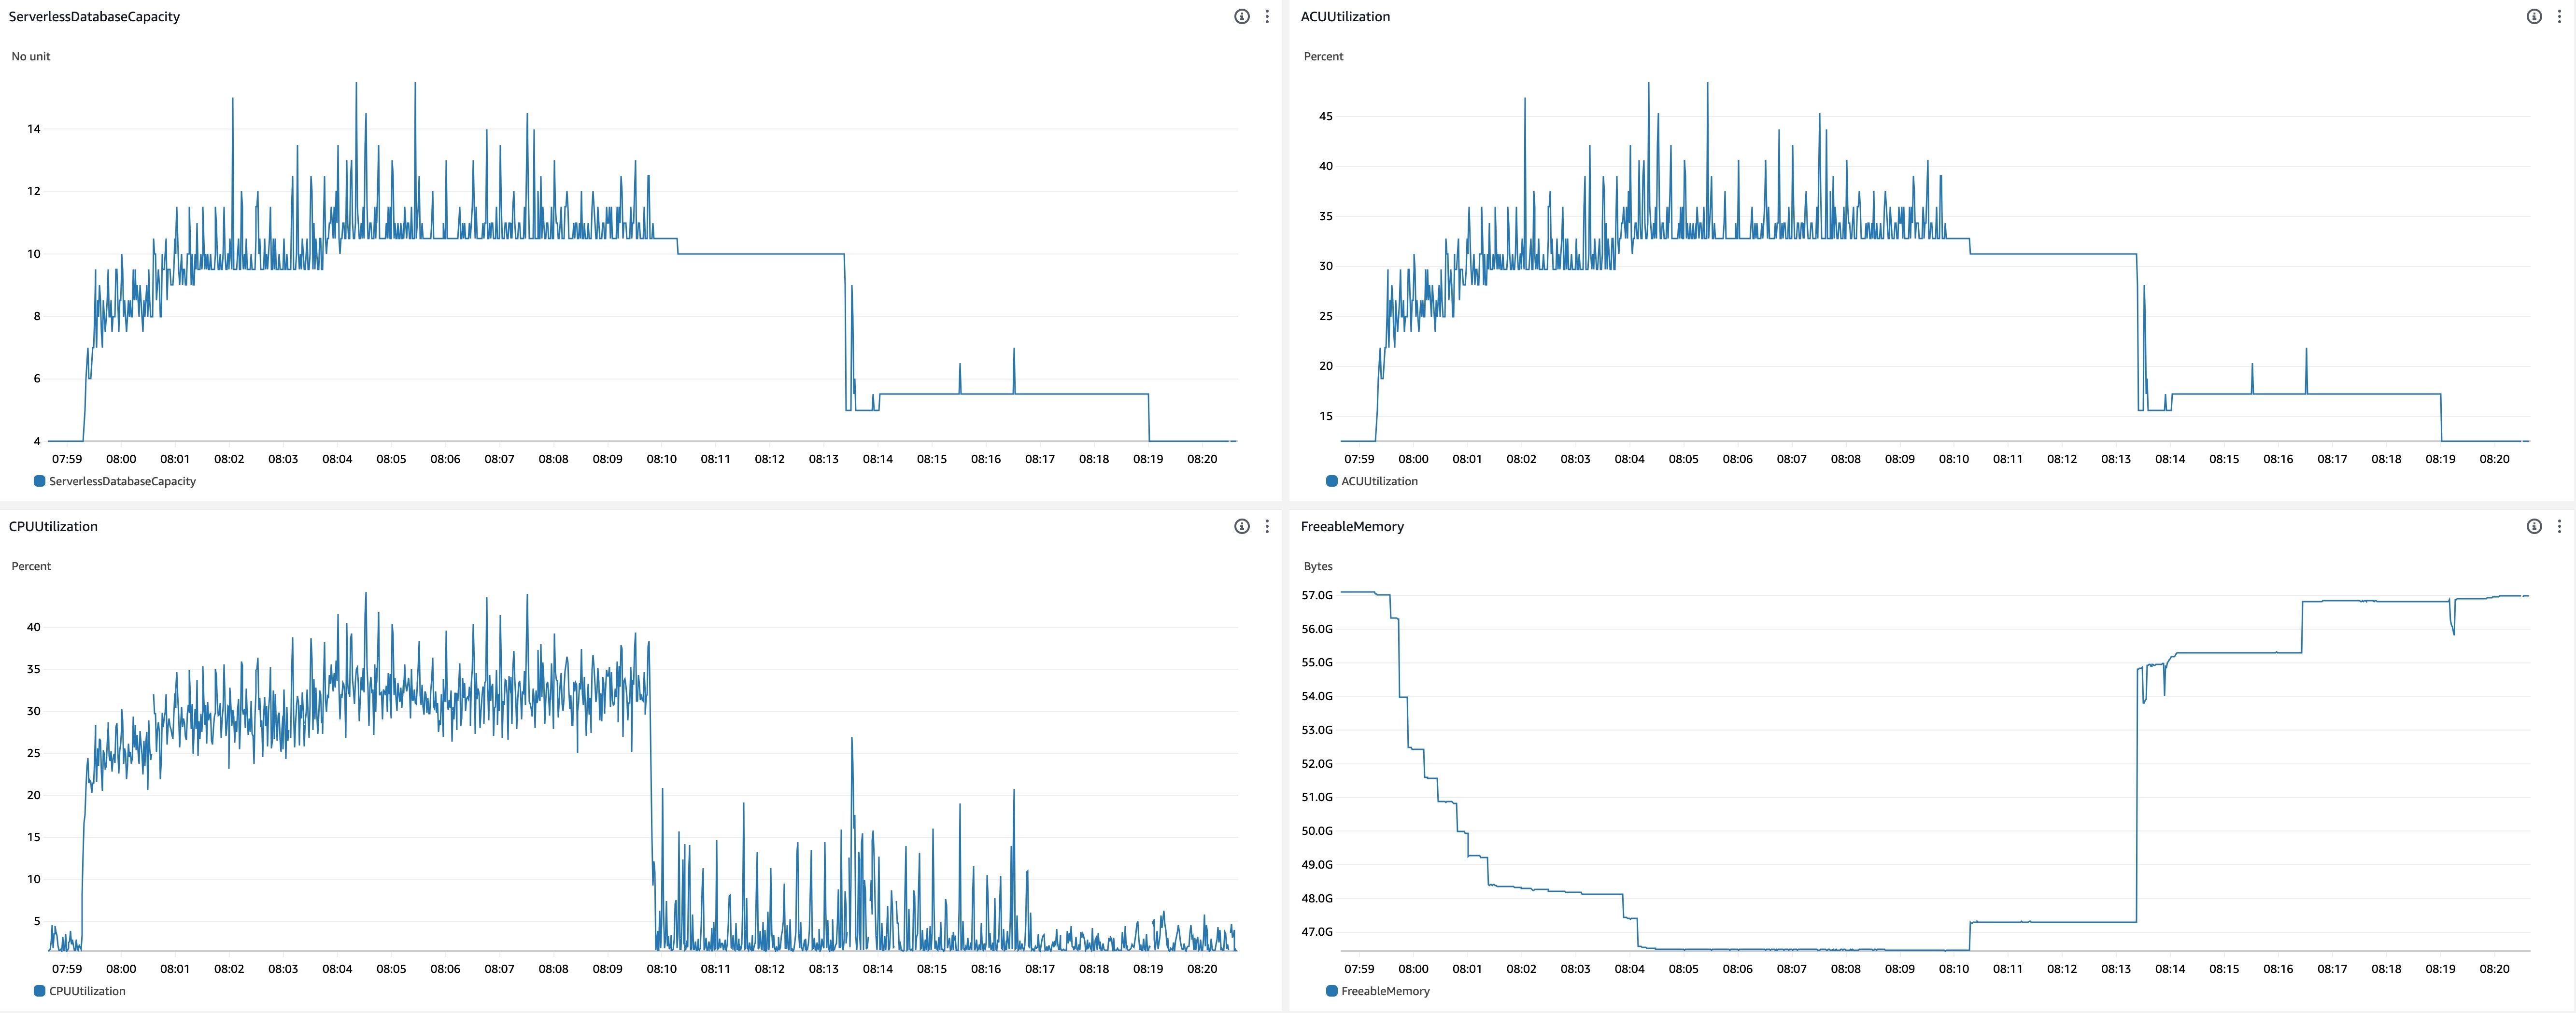
DB min/max = 4.0/32.0, Bench threads = 16
On this experiment, I checked the rate of scale up with larger minimum DB capacity.
-
CrowdWatch metrics related to scaling
- Scale up behavior
- 07:59:16 - Benchmark started
- 07:59:19 - ACU increased (4.0 -> 4.5)
- After this, ACU gradually increased to 10.5 with some fluctuation
- 07:59:39 -
shared_buffersincreased (5504MiB -> 6144MiB) - 07:59:48 -
shared_buffersincreased (6144MiB -> 8320MiB) - 07:59:58 -
shared_buffersincreased (8320MiB -> 9728MiB) - 08:00:15 -
shared_buffersincreased (9728MiB -> 10GiB) - 08:00:30 -
shared_buffersincreased (10GiB -> 11GiB) - 08:00:52 -
shared_buffersincreased (11GiB -> 12GiB) - 08:01:26 -
shared_buffersincreased (12GiB -> 13GiB) - 08:03:56 -
shared_buffersincreased (13GiB -> 14GiB)
- Scale down behavior
- 08:09:50 - Benchmark finished
- 08:13:19 -
shared_buffersdecreased (14GiB -> 6912MiB) - 08:13:24 - ACU decreased (10.0 -> 5.0)
- 08:16:24 -
shared_buffersdecreased (6912MiB -> 5504MiB) - 08:19:01 - ACU decreased (5.0 -> 4.0)
- Observations
- Scale up to ACU 10.5 was faster than the experiment started with ACU = 1.0.
- Timings of ACU scale up
- 16 seconds to scale up ACU from 4.0 to 8.0.
- 67 seconds to scale up ACU from 8.0 to 10.5.
- Timings of ACU scale up
- Scale down started about 3.5 minutes after the benchmark finished.
- Scale up to ACU 10.5 was faster than the experiment started with ACU = 1.0.
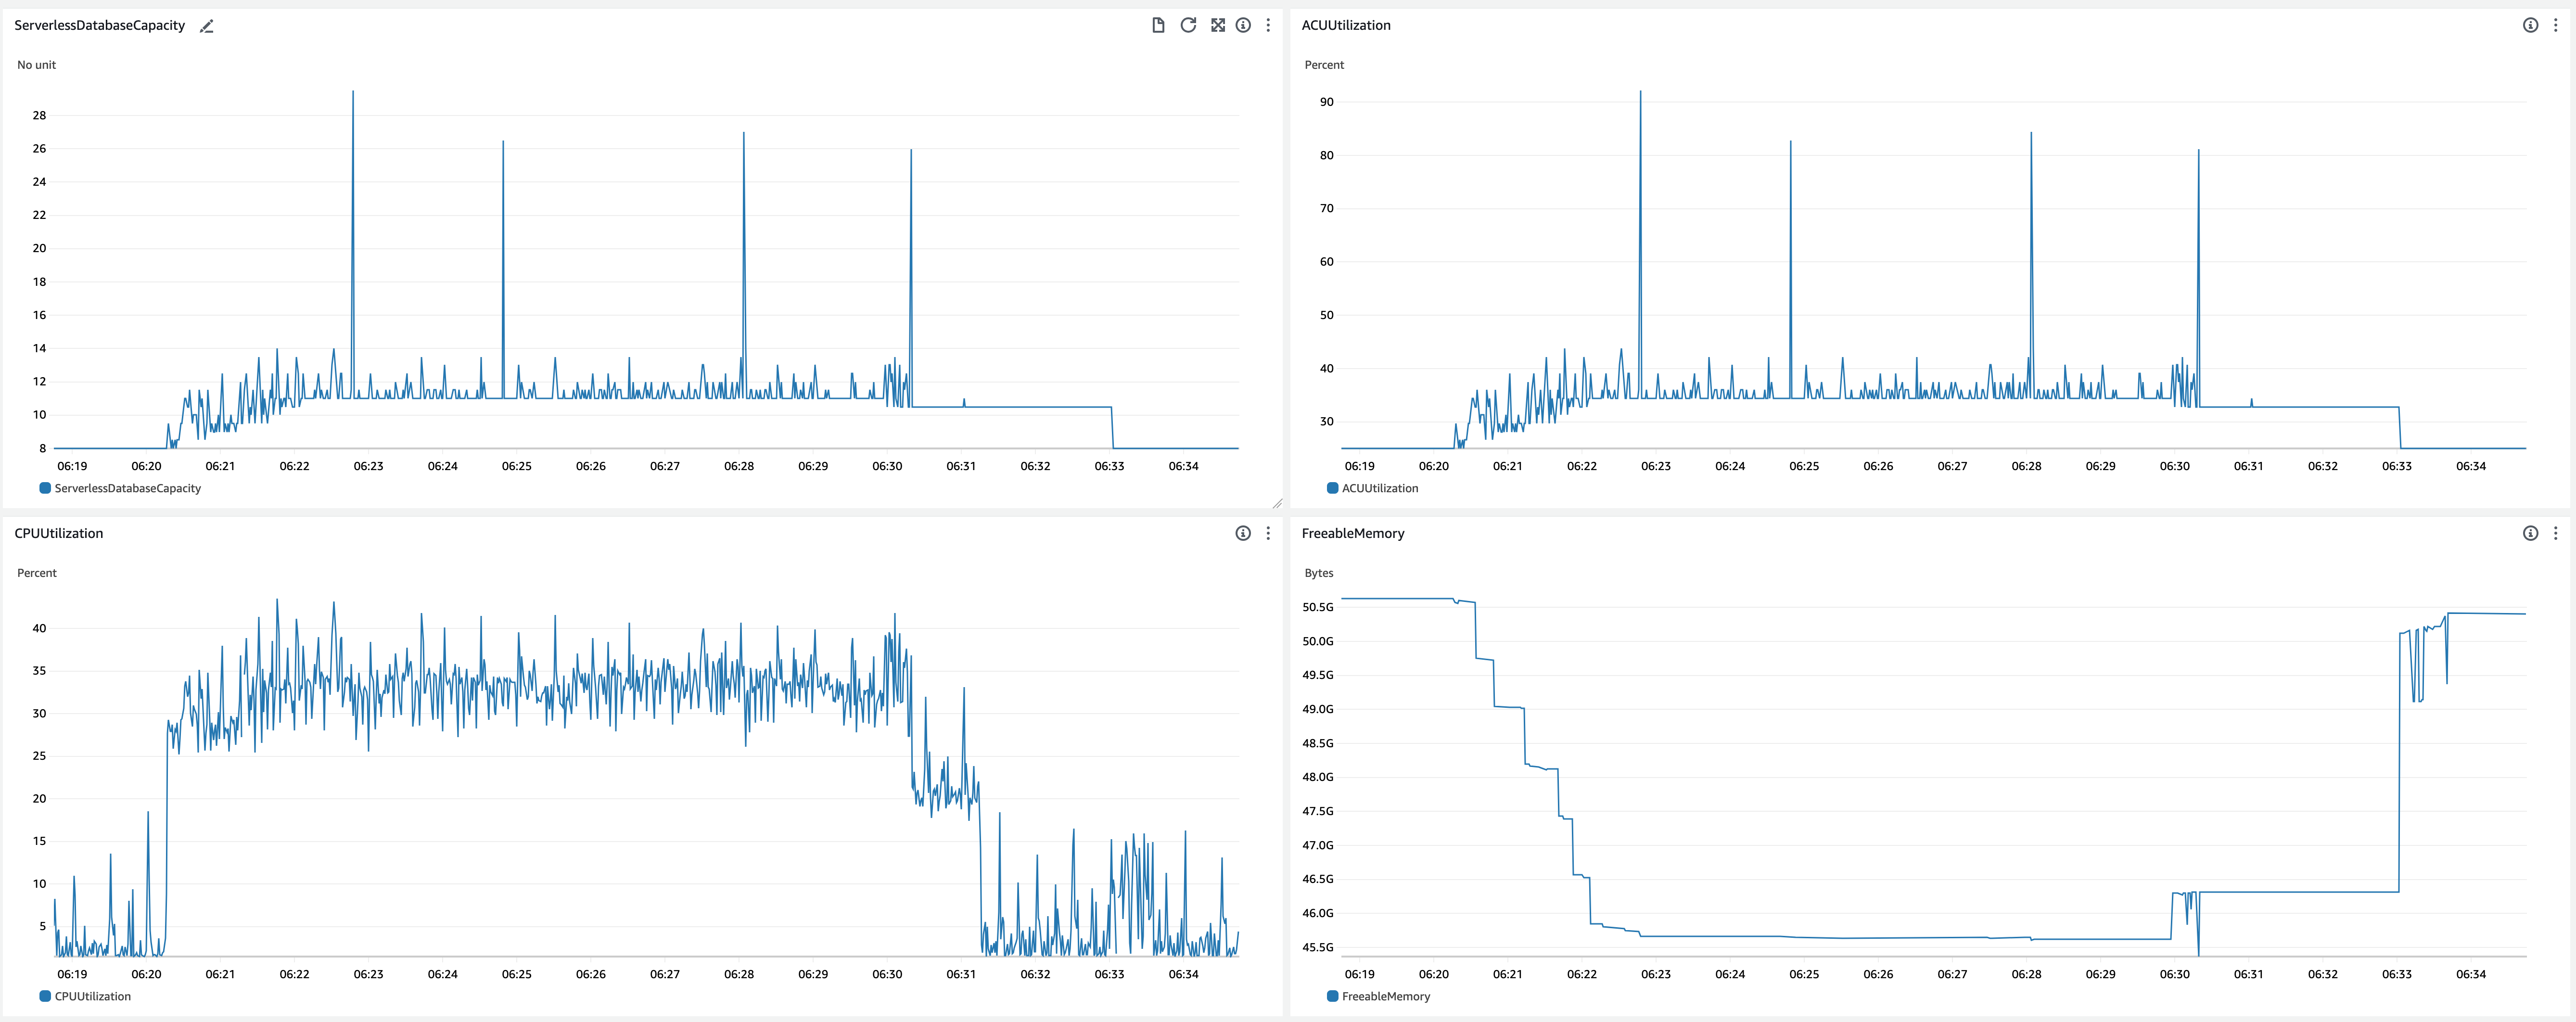
DB min/max = 8.0/32.0, Bench threads = 16
Increased min DB capacity more that the previous experiment.
-
CrowdWatch metrics related to scaling
- Scale up behavior
- 06:20:15 - Benchmark started
- 06:20:18 - ACU increased (8.0 -> 9.5)
- After this, ACU gradually increased to 11.0 with some fluctuation
- 06:20:40 -
shared_buffersincreased (11GiB -> 12GiB) - 06:21:17 -
shared_buffersincreased (12GiB -> 13GiB) - 06:21:44 -
shared_buffersincreased (13GiB -> 14GiB) - 06:22:11 -
shared_buffersincreased (14GiB -> 15GiB)
- Scale down behavior
- 06:29:54 -
shared_buffersdecreased (15GiB -> 14GiB) - 06:30:03 - ACU decreased (11.0 -> 10.5)
- 06:31:15 - Benchmark finished
- 06:32:58 -
shared_buffersdecreased (14GiB -> 11GiB) - 06:33:03 - ACU decreased (10.5 -> 8.0)
- 06:29:54 -
- Observations
- Scale up was faster than the experiment started with ACU = 4.0.
- Timings of ACU scale up
- 16 seconds to scale up from 8.0 to 11.0.
- Timings of ACU scale up
- Scale down started about 1.5 minutes after the benchmark finished.
- Scale up was faster than the experiment started with ACU = 4.0.
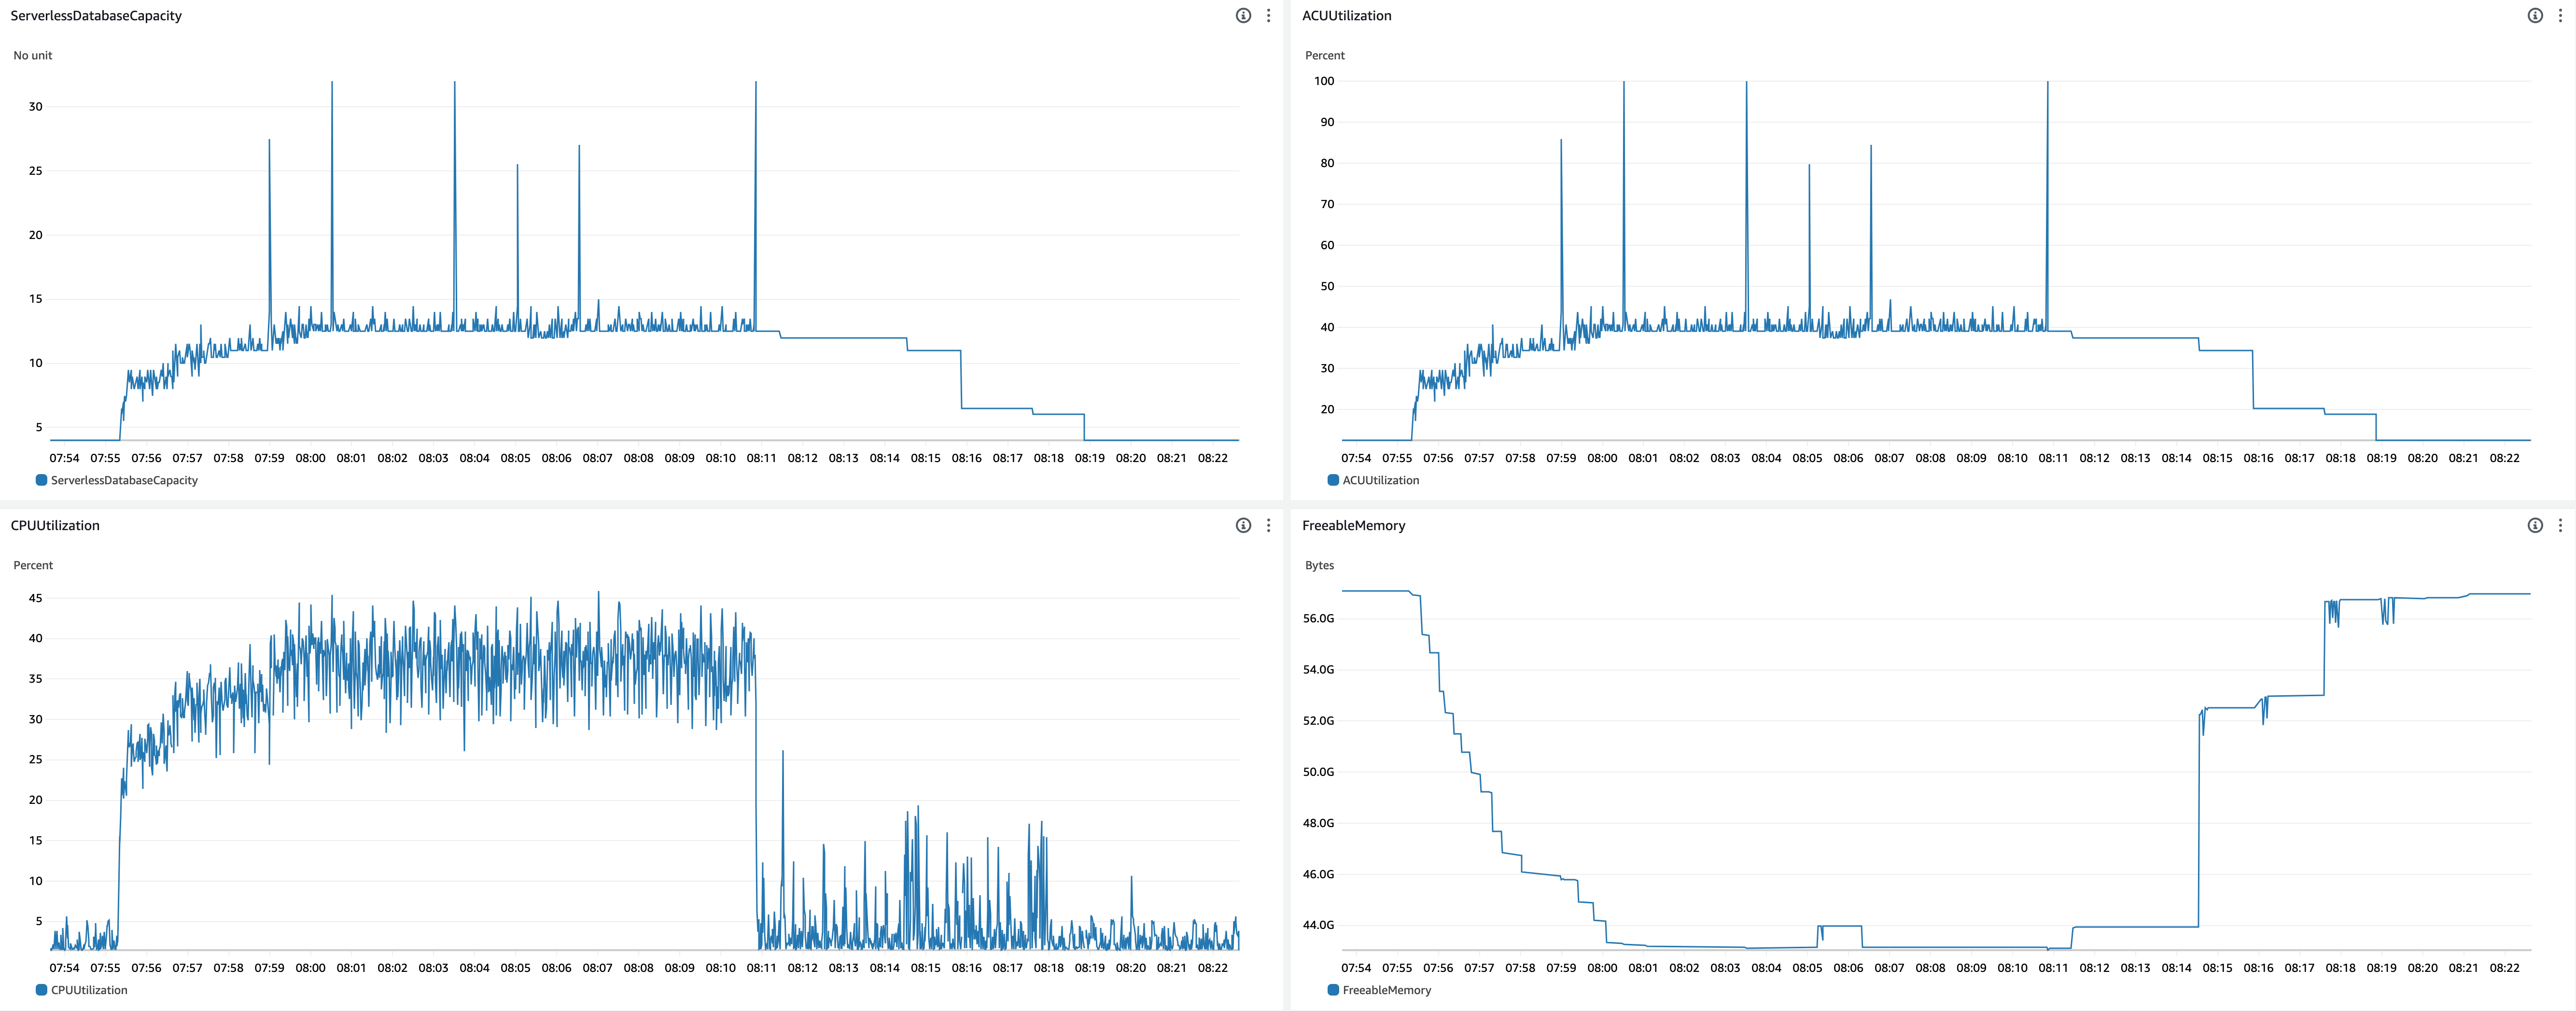
DB min/max = 4.0/32.0, Bench threads = 32
Finally, I stressed DB more to see scale up to more ACUs. On this experiment, the benchmark client server performance saturated. I don’t describe the detail of client performance as it’s out of scope of this document, but note that the workload incurred to DB was not twice as when benchmark threads was 16.
-
CrowdWatch metrics related to scaling
- Scale up behavior
- 07:55:17 - Benchmark started
- 07:55:23 - ACU increased (4.0 -> 6.5)
- After this, ACU gradually increased to 12.5 with some fluctuation
- 07:55:42 -
shared_buffersincreased (5504MiB -> 6912MiB) - 07:55:51 -
shared_buffersincreased (6912MiB -> 7552MiB) - 07:56:04 -
shared_buffersincreased (7552MiB -> 8960MiB) - 07:56:13 -
shared_buffersincreased (8960MiB -> 9728MiB) - 07:56:27 -
shared_buffersincreased (9728MiB -> 10GiB) - 07:56:38 -
shared_buffersincreased (10GiB -> 11GiB) - 07:56:52 -
shared_buffersincreased (11GiB -> 12GiB) - 07:57:23 -
shared_buffersincreased (12GiB -> 14GiB) - 07:58:05 -
shared_buffersincreased (14GiB -> 15GiB) - 07:59:29 -
shared_buffersincreased (15GiB -> 16GiB) - 08:00:10 -
shared_buffersincreased (16GiB -> 17GiB)
- Scale down behavior
- 08:10:53 - Benchmark finished
- 08:11:24 -
shared_buffersdecreased (17GiB -> 16GiB) - 08:11:28 - ACU decreased (12.5 -> 12.0)
- 08:14:29 -
shared_buffersdecreased (16GiB -> 8960MiB) - 08:14:33 - ACU decreased (12.0 -> 11.0)
- 08:15:52 - ACU decreased (11.0 -> 6.5)
- 08:17:34 -
shared_buffersdecreased (8960MiB -> 5504MiB) - 08:17:37 - ACU decreased (6.5 -> 6.0)
- 08:18:52 - ACU decreased (6.0 -> 4.0)
- Observations
- Timings of ACU scale up
- 15 seconds to scale up ACU from 4.0 to 8.0.
- 67 seconds to scale up ACU from 8.0 to 10.5.
- 108 seconds to scale up ACU from 8.0 to 12.5.
- Timings of ACU scale up
Overall observations from experiments
- The rate of scale up is faster on larger current DB capacity as described on the document.
- e.g. time to scale up ACU from 8.0 to 10.5 varied as follows by the DB capacity of when scale up started.
- 138 seconds when ACU was 1.0 when scale up started
- 67 seconds when ACU was 4.0 when scale up started
- 16 seconds when ACU was 8.0 when scale up started
- You need to set the minimum ACU high enough so that scale up to the peak time ACU happens in reasonable time.
- In any minimum ACU configurations, scale up of first 2-3 ACU happens very quickly, e.g. a few seconds after workload increase.
- e.g. time to scale up ACU from 8.0 to 10.5 varied as follows by the DB capacity of when scale up started.
- When DB capacity is small like 1, the ratio of shared buffer size to available memory size was smaller than when DB capacity is large. e.g.
- On ACU = 1.0 (available memory size = 2GiB), shared buffer size = 384MiB (19%)
- On ACU = 2.5 (available memory size = 5GiB), shared buffer size = 2688MiB (52%)
- On ACU = 4.0 (available memory size = 8GiB), shared buffer size = 5504MiB (67%)
- The ratio seems the same for ACU more than 4.0.
- ACU changes every second. On the other hand, scale up of
shared_bufferssize happens every 10-20 seconds.- We need to be careful if memory size usage were to increase significantly when the workload suddenly increases. The DB may suffer from poor buffer cache hit rate while
shared_buffersis resizing. - ACU repeats scale up and down in a very short term, but scale down has lower bound on the ACU that is required to keep the current
shared_bufferssize.- i.e. the ratio of
shared_bufferssize to available memory size never be higher than some threshold. I don’t know the exact numbers of threshold because it isn’t written on the specification, though. - e.g. when
shared_bufferssize is 5504MiB, ACU is never lower than 4. - When ACU scales down to the value that is insufficient to keep the current
shared_bufferssize,shared_buffersshrinks first and then ACU scales down.
- i.e. the ratio of
- We need to be careful if memory size usage were to increase significantly when the workload suddenly increases. The DB may suffer from poor buffer cache hit rate while
- It seems the larger increase of ACU was, the longer Aurora Serverless v2 waits before scale down.
- On the experiments, time took to scale down was as follows
- 1.5 minutes when ACU increase was 1.0 -> 2.5
- 1.5-2 minutes when ACU increase was 1.0 -> 4.0
- 5 minutes when ACU increase was 1.0 -> 10.5
- 3.5 minutes when ACU increase was 4.0 -> 10.5
- 1.5 minutes when ACU increase was 8.0 -> 10.5
- I guess the wait is caused by shared buffer eviction process. When it needs to shrink large memory, more pages on shared buffers need to be evicted.
- On the experiments, time took to scale down was as follows
Remaining questions
- Scale up behavior on ACU more than 13
- I’ve tested until ACU = 12.5
- Further benchmarking is possible with the same application, but stopped at this point because our application doesn’t require such many vCPUs for now.
- Parallel query behavior
- PostgreSQL has some operators that are processed by multiple processes concurrently. They are typically used for OLAP queries, so I didn’t check them in detail.
- Performance overhead of shared buffer resize process
- The overview of shared buffer scale down procedure is available on p.12 of this slide.
- On the original postgres,
shared_bufferscannot be changed dynamically. Aurora Serverless v2 has some trick to make it dynamic.
Summary
From performance perspective, I think Aurora Serverless v2 is ready for production applications. (If you actually think to use it for production, you must evaluate for your use case, of course.)
It can almost seamlessly scale up DB capacity. I haven’t noticed significant outage or delay during benchmarking. Scale up to add a few ACUs is fairly fast. It completed in a few seconds in my experiment. For further scale up, it required tens of seconds to minutes. It depends on the gap between the ACU before scale up started and the target ACU. If you need to scale up DB capacity to large ACU quickly, you should set the minimum ACU high enough to scale up fast. It means there is a trade-off between cost efficiency, i.e. set minimum ACU to low, and latency, i.e. scale up quickly. As you may notice, we still need some capacity planning even with Aurora Serverless v2. (Note that it requires DB restart to change min/max DB capacity.) However, it’s easier than capacity planning for provisioned instance in my opinion.
Aurora Serverless v2 looks very promising so far, but considering relatively high unit price, i.e. price per vCPU hour or price per memory hour, it isn’t for all applications but only for applications which have highly variable workload. Pricing of Aurora Serverless v2 is good for applications that has high CPU demand at peak time. If your application has large data set to work on, it may be favourable for provisioned instance. Price per memory hour of Aurora Serverless v2 is not good.
If you provisioned DB capacity for the peak workload and the peak workload doesn’t last for a long period, you likely to have a chance to save DB cost by using Aurora Serverless v2 instead of provisioned instance. The break even point varies by various factors, so you should compare the cost of serverless and provisioned instance for your use case.
Another promising use case is to create a new application that workload will gradually increase after launch. Aurora Serverless v2 makes you free from DB capacity estimation for future demand.